
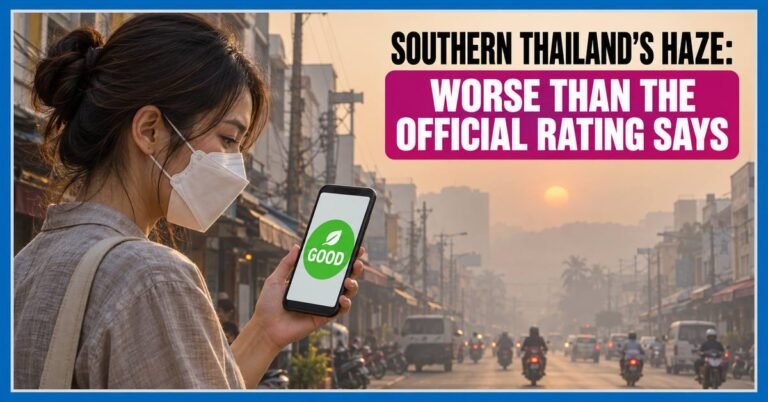
Indonesia’s haze keeps reaching southern Thailand. It’s worse than the official rating says.
by Karl von Luckwald / October 17, 2026
Updated 18 October 2026
In short: Southern Thailand’s air has been worse than the official rating says. Since August it spiked six times, in step with Indonesia’s fires. In Narathiwat, the daily average was above the World Health Organization’s guideline on 22 of the last 78 days: 1.7 times the guideline on average, and 2.5 times on the worst day. Yet on Thailand’s own scale, 21 of those 22 days rate “good” or “moderate”, because Thailand’s limit is two and a half times the WHO’s.
This week, the haze got worse again
Sumatra and Kalimantan have had more fire hotspots this year than in any year since 2015, and the smoke is spreading across the region. By 17 October, Singapore had 13 straight days of unhealthy air, its longest run since 2015 (The Star). On 16 October, Singapore ordered seven Indonesian companies to stop burning on their land (NEA).
Southern Thailand is on the edge of the same cloud. On 9 October, haze covered Betong in Yala so thickly the sun turned orange. The town’s hospital handed out free masks and reported more patients with breathing, heart and eye problems (MGR Online). From 14 October, readings near the Malaysian border rose again.
Southern Thailand’s air spiked six times since August
We took hourly fine-dust (PM2.5) readings from all 13 of the Pollution Control Department’s stations in southern Thailand, from 1 August to 17 October, and worked out a daily average for each.
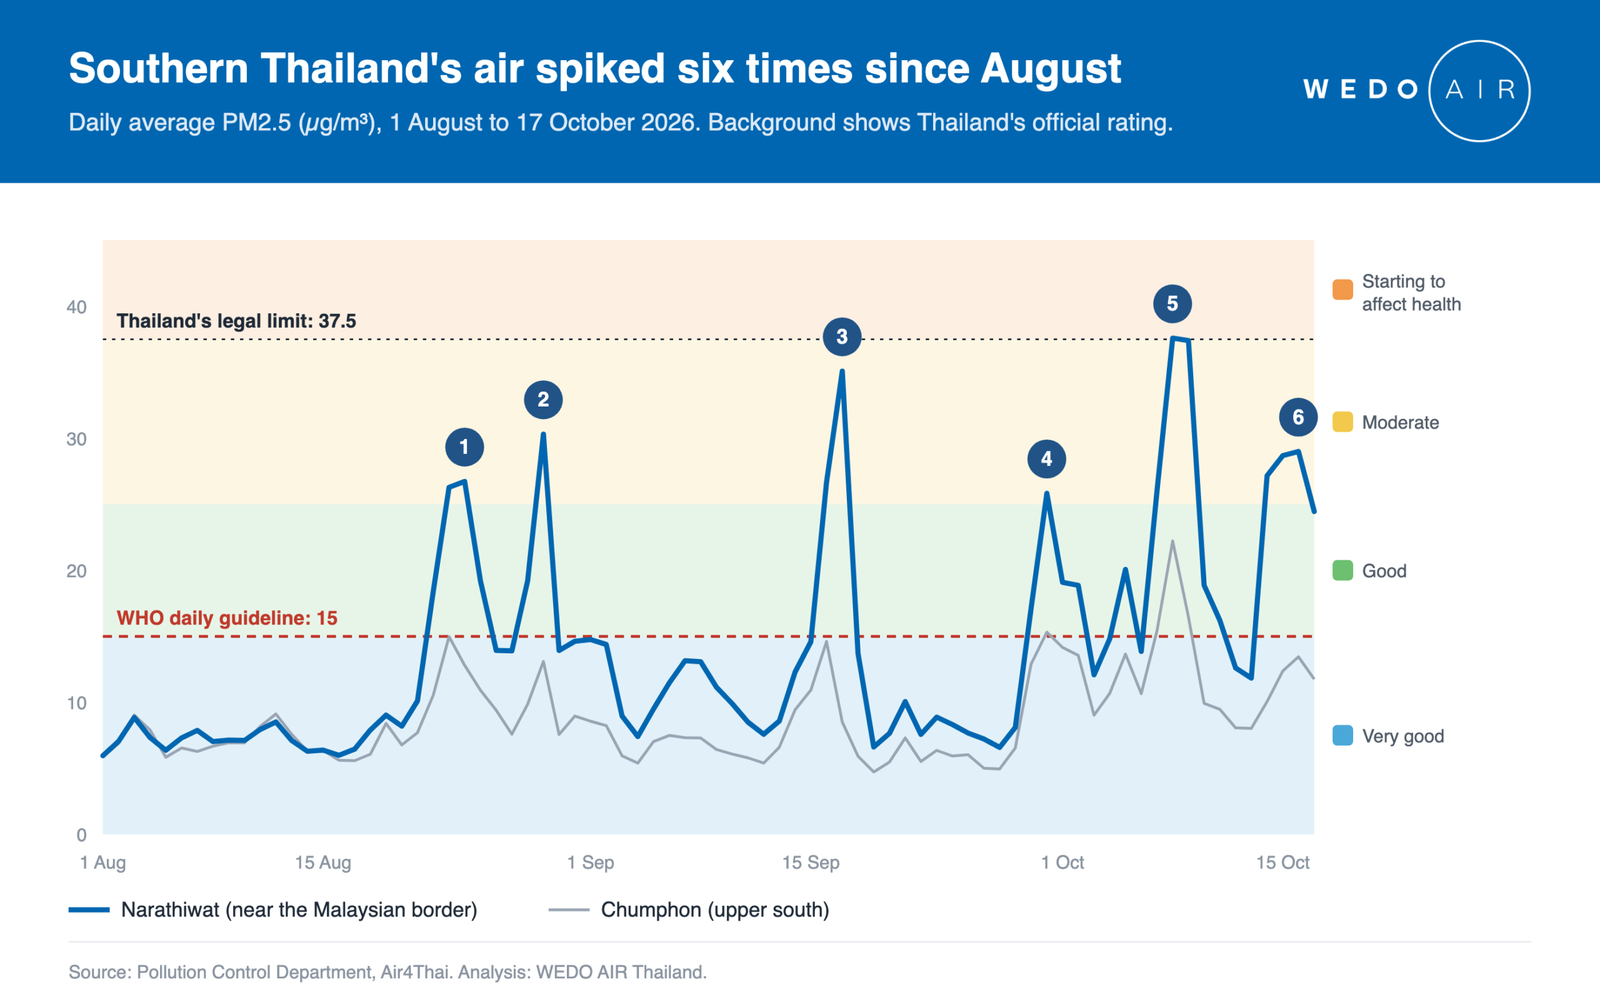
In early August the south’s air was clean, at about 7 µg/m³. Then it spiked six times: 23 to 24 August, 29 August, 16 to 17 September, 30 September, 7 to 9 October, and 14 to 17 October. Each episode lasted one to four days.
At the worst, on 8 October, Narathiwat’s daily average reached 37.6 µg/m³, five times the clean air of early August. The worst single hour, at 2am on 29 August, hit 54 µg/m³, more than seven times the early-August average. By Berkeley Earth’s rule of thumb, a day at 22 µg/m³ is roughly like smoking one cigarette, so breathing Narathiwat’s air on the worst day was close to two.
The pattern points south. On the worst day, 8 October, readings were highest in the lower south (Hat Yai 38.2, Narathiwat 37.6 µg/m³) and lowest up in Chumphon (22.2). Chiang Mai, far to the north, showed no such spikes.
We didn’t model wind direction, so we can’t prove every spike came from Indonesia. But the timing matches: the late-August spikes came in the same week ASEAN raised its top haze alert, and the October spikes overlap with Singapore’s worst days.
On most of those days, Thailand’s scale rated the air “good” or “moderate”
Thailand rates daily PM2.5 on a five-colour scale. The World Health Organization sets one number instead: its guideline for a daily average is 15 µg/m³.
|
Daily PM2.5 (µg/m³) |
Thailand’s rating |
Compared with the WHO guideline (15) |
|---|---|---|
|
0 to 15 |
Very good (blue) |
Within it |
|
15.1 to 25 |
Good (green) |
Above it |
|
25.1 to 37.5 |
Moderate (yellow) |
Above it |
|
37.6 to 75 |
Starting to affect health (orange) |
Above it |
|
75.1 and over |
Affects health (red) |
Above it |
Thai bands from the Pollution Control Department’s 2023 scale (Thai PBS).
So two whole colour bands, green and yellow, sit above the WHO guideline. Thailand’s legal limit of 37.5 µg/m³ matches the WHO’s third “interim target”, a stepping stone for countries working toward the guideline (WHO).
Here is what that meant in Narathiwat, day by day:
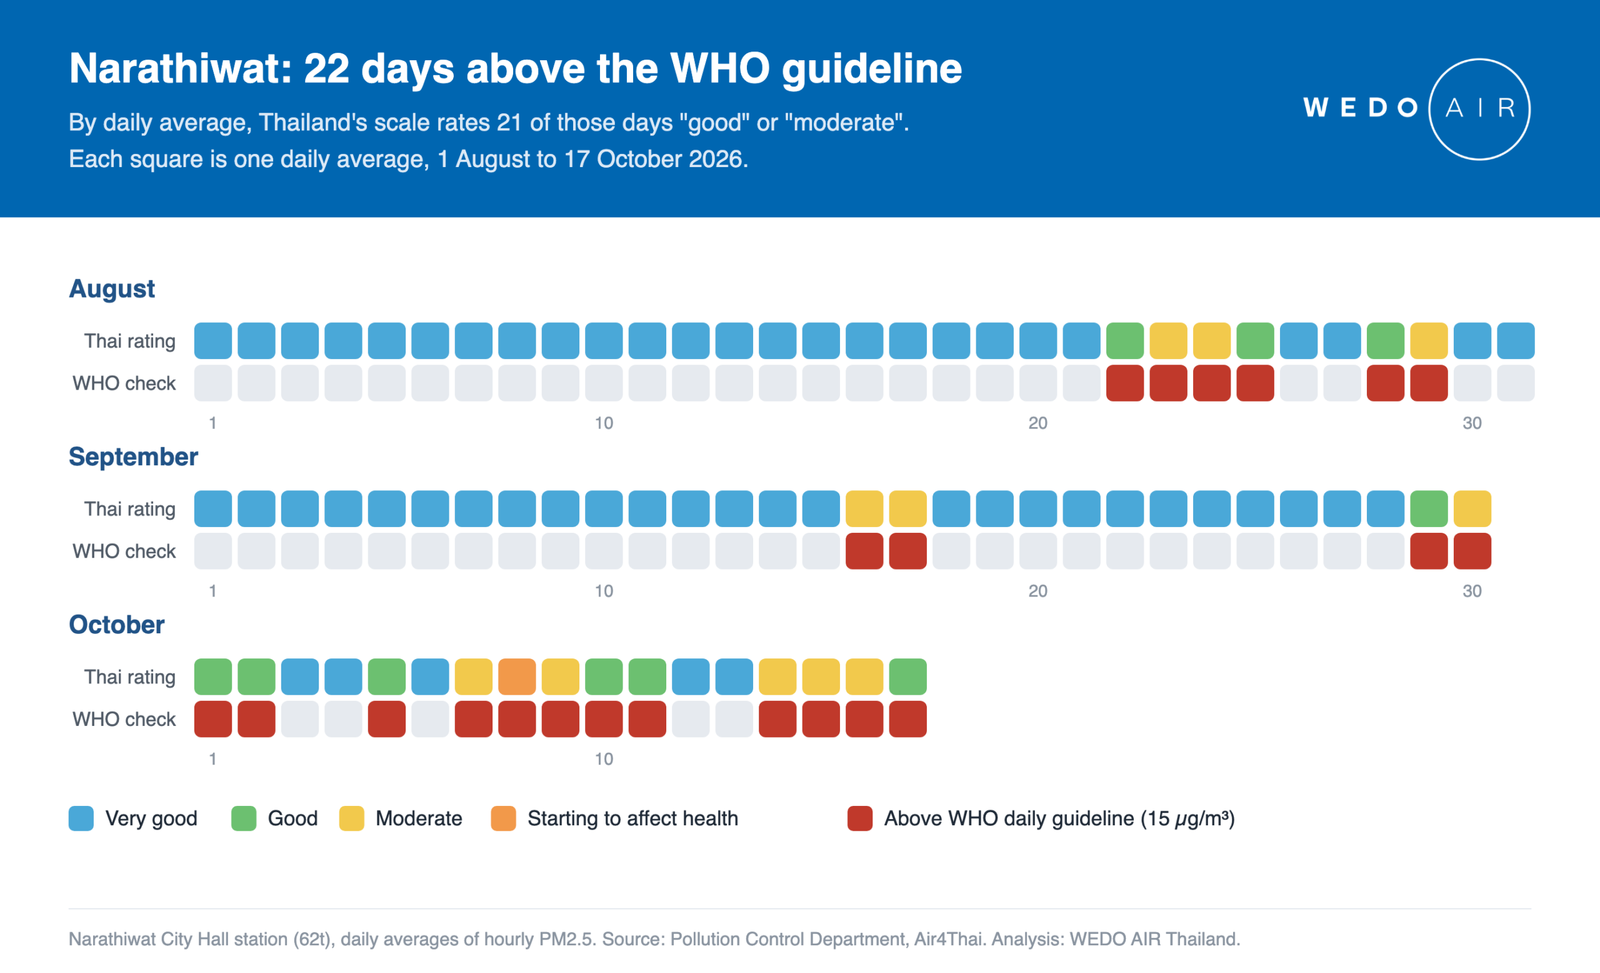
That’s 22 days above the WHO guideline. By daily average, 21 of them fall in Thailand’s green or yellow bands. Thailand’s live rating uses a rolling 24-hour average, which briefly touched orange on two of those days, 17 September and 9 October. Hat Yai, Yala and Pattani look almost the same. On 1 October, for example, the regional environment office described the lower south’s air as “good”, with 24-hour averages of 20 to 22 µg/m³ (MGR Online).
The ratings follow Thai law. The problem is that a green or yellow day gives most people no reason to change anything, even when the smoke is back.
The smoke comes from Indonesia’s biggest fire season since 2015
ASEAN’s weather centre counted 38,511 fire hotspots in Sumatra and Kalimantan by 13 October, the most since 2015 (The Star). Indonesia’s own figure for burned land, about 202,000 hectares, has not been updated since July (Reuters). Independent satellite mapping, which includes August, puts it at 895,657 hectares (Down to Earth).
Indonesia’s health ministry has counted 283,270 cases of acute respiratory infection in seven provinces since 18 August (CNN Indonesia). Our data notes list every regional figure, its source and what it measures.
If you live in the south, check the number
- Look at µg/m³, not only the colour. The free Air4Thai app shows the PM2.5 number for your nearest station. If the 24-hour average is above 15, it is above the WHO guideline, whatever colour the app shows.
- Watch the hourly trend. In our data, the spikes came and went within one to four days. An indoor air quality monitor shows the number inside your home or classroom.
- Protect those most at risk. Betong’s hospital advised children, pregnant women, older people and anyone with heart or lung disease to cut back on strenuous outdoor activity on smoky days.
- Clean the air indoors. On spike days, keep windows closed and run an air purifier with a HEPA filter, sized for the room. Our guide do air purifiers work? explains what they can and can’t do, and our air purifier range covers everything from bedrooms to classrooms.
What comes next
Singapore’s environment minister expects conditions to improve about three to four weeks after 16 October, when the inter-monsoon period brings lighter, more variable winds (The Star).
Then attention turns north. Forecasters expect a strong El Niño through March 2027 (NOAA), and Thailand’s water office warns of dry spells that could last into 2027 (The Nation). Northern Thailand’s burning season follows in the dry months early next year. Our guide to the best air purifier for wildfire smoke covers what to look for before then. The same rating gap applies there: even in this year’s rainy season, Chiang Mai was above the WHO guideline on 49 of the 78 days we studied.
Data and method. Hourly PM2.5 from the Pollution Control Department’s Air4Thai network, downloaded 18 October 2026. Daily figures are calendar-day averages, used only where at least 18 hourly readings existed, rounded to one decimal. Thailand’s bands are applied to these daily values; the live rating uses rolling 24-hour averages, so it can differ on individual days. An episode is a day when any southern station averaged 24 µg/m³ or more. Recent readings may be revised after the department’s checks. Download the daily data (CSV). Full station table and limits: data notes.
Using these figures? Please credit WEDO AIR Thailand and link to this page: wedo-air.com/blog/southern-thailand-haze-2026.

Karl von Luckwald
Since moving to Thailand in 2019, Karl noticed the lack of scientific integrity in air purifier and water filter reviews. In response, he founded WE DO AIR to champion unbiased, science-based evaluations and empower consumers to make better-informed decisions.