
2026 Southeast Asia haze: data notes and sources
by Karl von Luckwald / October 17, 2026
Updated 18 October 2026. This page backs up our article Indonesia’s haze keeps reaching southern Thailand.
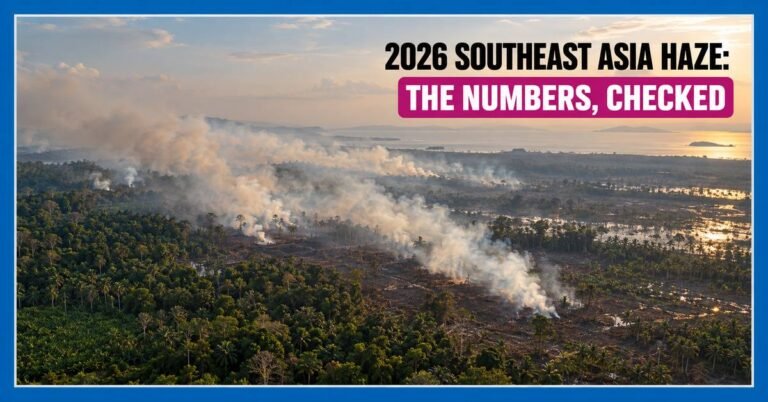
The 2026 haze figures in circulation often disagree because they measure different things. This page lists each figure with its source, its date and what it actually counts. It’s written for journalists, researchers and anyone who needs to quote a number correctly.
Burned area in Indonesia
|
Estimate |
Area |
Period |
Method |
|---|---|---|---|
|
Indonesian government (SiPongi) |
202,004 ha |
Jan to Jul |
Official ministry mapping |
|
Auriga Nusantara (NGO) |
more than 637,000 ha |
Jan to Aug |
Not described in the source |
|
Nusantara Atlas |
895,657 ha |
To end of August |
Sentinel-2 satellite imagery at 20 m, designed to give conservative, high-confidence detections |
|
MADANI Berkelanjutan (NGO) |
about 1.32 million ha |
Jan to Aug |
“Indicative” model, method not described in the source |
Sources: Kompas (official figure, up 69% on the same period of 2025); Reuters (Auriga, and that the official figure has not been updated since July); Nusantara Atlas and Down to Earth (895,657 ha); MADANI Berkelanjutan.
Note on “more than 895,000 hectares”. Much international coverage uses this figure, sometimes without attribution. It comes from Nusantara Atlas, an independent project, and the Indonesian government has not published it.
Note on “639 hectares”. On 12 October the head of BNPB, Indonesia’s disaster agency, told the president that 639.23 hectares were still burning and being handled by field task forces in six provinces (CNBC Indonesia). BNPB and the Forestry Ministry later confirmed it covers only areas under active firefighting (Mongabay). It should never be quoted as burned area.
Hotspots
A hotspot is a satellite pixel hotter than its surroundings. Indonesia’s Forestry Ministry says hotspot counts cannot be equated with the number of fires or the area burned (Kemenhut).
Four official counts for the same day, 14 October:
|
Source |
Count |
Filter |
|---|---|---|
|
SiPongi, all confidence levels |
20,334 |
Low, medium and high confidence, 24 hours |
|
SiPongi, high confidence only |
1,784 |
High confidence, 24 hours |
|
BMKG |
1,297 |
High confidence |
|
Forestry Ministry release |
372 |
High confidence, to 9pm |
Sources: DPR RI, Okezone citing BMKG, Kemenhut.
Season totals:
|
Source |
Count |
Area |
Period |
|---|---|---|---|
|
ASEAN Specialised Meteorological Centre |
38,511 |
Kalimantan and Sumatra |
To 13 Oct; high-confidence daytime VIIRS detections |
|
2015, as reported |
58,106 |
Kalimantan and Sumatra |
2015 |
|
Nusantara Atlas FireWatch |
1,061,746 |
All of Indonesia |
Cumulative to 14 Oct |
Sources: The Star (ASMC figures); Down to Earth (FireWatch).
Why counts differ:
- Area: Kalimantan and Sumatra only, or all of Indonesia including Papua.
- Confidence filter: high confidence only, or every detection.
- Time window: one day, or cumulative since 1 January.
- Sensor: NASA’s VIIRS instrument uses pixels of about 375 metres; the older MODIS sensor uses 1 kilometre. Finer pixels produce more detections for the same fire.
- Repeat detections: one fire front can register as several hotspots, and each sensor records its own detections.
Greenpeace has reported 5,540 “haze-source spots” between 8 August and 20 September (Greenpeace Southeast Asia). This is a Greenpeace-defined count whose method is not published in the release, so it should be kept apart from hotspot totals.
People exposed
|
Estimate |
People |
Date |
Basis |
|---|---|---|---|
|
Indonesian health ministry |
about 5.5 million |
31 August |
“Directly exposed to smoke”, Borneo and Sumatra |
|
Indonesian health ministry |
more than 12.5 million |
reported 11 September |
“Exposed to haze”, seven provinces |
|
Greenpeace |
about 40 million |
22 September |
Over two months, Kalimantan and Sumatra; method not described |
|
CREA |
more than 41 million |
18 August |
Single-day peak in air rated “Unhealthy” |
Sources: Al Jazeera (5.5 million, Deputy Health Minister Dante Saksono Harbuwono); Down to Earth citing Reuters (12.5 million); Greenpeace (40 million); CREA (41 million, about 15% of Indonesia’s population).
The two government figures appear to be successive updates. CREA’s figure is a one-day peak based on modelled air quality, readings from 171 ground monitors and population data.
Health
|
Figure |
Value |
Scope |
Source |
|---|---|---|---|
|
Acute respiratory infections |
283,270 cases (63,711 under five) |
Seven Indonesian provinces, 18 Aug to 13 Oct |
CNN Indonesia, citing the health ministry |
|
Malaysia, asthma |
up 259% (61 to 219) |
Epidemiological weeks 32 to 33, announced 23 Aug |
|
|
Malaysia, upper respiratory infections |
up 124% (1,637 to 3,674) |
Same weeks |
The Star |
|
Sarawak school closures |
647 schools, about 198,600 pupils |
Announced for 7 to 11 Sep, 12 district education offices |
|
|
Deaths from fire smoke (modelled) |
about 1,700 |
August, 15 Indonesian provinces |
CREA |
|
Deaths from non-fire pollution (modelled) |
about 2,000 |
August, same provinces |
CREA |
|
Firefighter deaths |
4 |
Bromo Tengger Semeru National Park, East Java, 15 Oct |
The figure of “more than 170,000” respiratory cases still cited in some reports appears to be an earlier cut of the same ministry data. CREA’s death figures are modelled estimates of short-term exposure for one month.
Is 2026 the worst since 2015?
|
Metric |
2026 so far |
2015 |
Worse than 2015? |
|---|---|---|---|
|
Hotspots, Kalimantan and Sumatra (ASMC) |
38,511 to 13 Oct |
58,106 |
No, but the highest since 2015 |
|
Singapore consecutive unhealthy days |
13 (to 17 Oct) |
14 (Straits Times count) |
Not yet; the longest since 2015 |
|
Fire carbon emissions (CAMS) |
140.5 Mt carbon to 6 Oct, highest since 2019 |
No 2015 total on the same basis |
Not yet known |
|
Burned area, official |
202,004 ha to July |
about 2.6 million ha |
Not on available data |
Sources: The Star (hotspots); Straits Times via Asia News Network and The Star (Singapore); AFP via Phys.org (emissions); Gaveau et al., Earth System Science Data (2015 burned area).
On emissions, Copernicus scientist Mark Parrington told the Jakarta Post in September that 2026 might finish above 2019 but below 2015, while stressing the forecast rests on assumptions. Carbon Brief, using a different inventory (GFED), found 2026 emissions on the same trajectory as 2015.
For health impact, a study in Environmental Research Letters modelled about 100,300 excess deaths from the 2015 haze across Indonesia, Malaysia and Singapore. No comparable full-season estimate exists for 2026 yet.
Singapore and the regional alert
On 16 October Singapore’s National Environment Agency announced preventive measure notices under the Transboundary Haze Pollution Act to seven Indonesian companies:
- PT Bumi Andalas Permai
- PT Bumi Mekar Hijau
- PT Paramitra Mulia Langgeng
- PT Sumatera Alam Anugerah
- PT SBA Wood Industries
- PT Hutan Lestari Raya
- PT Bangkanesia
The notices require the companies to deploy firefighters, stop burning and submit action plans. NEA said there are indications smoke from their concessions could have reached Singapore; it has not made a finding. Mothership notes three of the seven also received notices in 2015.
|
Date |
Event |
Source |
|---|---|---|
|
26 Aug |
Southern ASEAN region raised to Alert Level 3 (highest of four) |
|
|
16 Oct |
ASMC announces “Activation of Alert Level 3” for the region |
|
|
17 Oct, 7pm |
Singapore 24-hour PSI 130 to 199 (Unhealthy) |
Southern Thailand: full station data
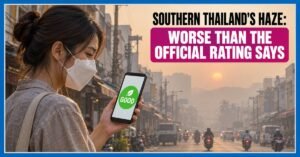
We took hourly PM2.5 readings from all 13 Pollution Control Department stations in southern Thailand for 1 August to 17 October 2026 (78 days) and calculated a daily average for each.
|
Station |
Average |
Highest day (µg/m³) |
Days above WHO 15 |
Days above Thai 37.5 |
|---|---|---|---|---|
|
Narathiwat |
13.9 |
37.6 |
22 |
1 |
|
Yala |
13.7 |
37.5 |
22 |
0 |
|
Pattani |
13.5 |
37.2 |
22 |
0 |
|
Betong, Yala |
13.2 |
37.2 |
22 |
0 |
|
Hat Yai, Songkhla |
13.2 |
38.2 |
22 |
1 |
|
Satun |
12.0 |
35.3 |
19 |
0 |
|
Phuket |
12.0 |
29.3 |
20 |
0 |
|
Nakhon Si Thammarat |
11.9 |
33.1 |
19 |
0 |
|
Surat Thani |
11.8 |
29.2 |
19 |
0 |
|
Trang |
11.4 |
30.4 |
17 |
0 |
|
Phatthalung |
11.3 |
30.4 |
16 |
0 |
|
Krabi |
9.4 |
26.5 |
8 |
0 |
|
Chumphon |
8.8 |
22.2 |
4 |
0 |
|
Bangkok (station 05t), for comparison |
13.8 |
28.0 |
28 |
0 |
|
Chiang Mai (station 35t), for comparison |
15.8 |
21.8 (19 Aug) |
49 |
0 |
Daily averages in µg/m³, rounded to one decimal. Every station’s highest day was 8 October, except Chiang Mai (19 August). Trang has 75 valid days; all other stations have 78.
Days by Thailand’s official rating. Using the Pollution Control Department’s 2023 bands (very good 0 to 15, good 15.1 to 25, moderate 25.1 to 37.5, starting to affect health 37.6 to 75 µg/m³; Thai PBS). Bands are applied to the one-decimal daily averages. Thailand’s live rating uses rolling 24-hour averages, which touched orange in Narathiwat and Yala on 17 September and 9 October:
|
Station |
Very good |
Good |
Moderate |
Starting to affect health |
|---|---|---|---|---|
|
Narathiwat |
56 |
10 |
11 |
1 |
|
Yala |
56 |
10 |
12 |
0 |
|
Pattani |
56 |
13 |
9 |
0 |
|
Hat Yai, Songkhla |
56 |
16 |
5 |
1 |
|
Phuket |
58 |
18 |
2 |
0 |
Every day above “very good” is also above the WHO’s daily guideline of 15 µg/m³. Thailand’s 24-hour standard of 37.5 µg/m³ equals the WHO’s third interim target (WHO global air quality guidelines, 2021).
Episodes. We define an episode as a day when any southern station averaged 24 µg/m³ or more. That gives six episodes: 23 to 24 August, 29 August, 16 to 17 September, 30 September, 7 to 9 October, and 14 to 17 October.
Comparison stations. Chiang Mai, in its rainy season and without comparable spikes, still exceeded the WHO guideline on 49 days, and Bangkok’s station 05t on 28. Ordinary urban air regularly crosses the WHO guideline too.
Earlier reports. On 16 September a Prince of Songkla University centre measured 89.0 µg/m³ in Hat Yai at 8:10am (Thai PBS World). On 17 September the Pollution Control Department reported 24-hour averages of 13.7 to 42.1 µg/m³ across the south and said Yala and Narathiwat were above the standard (The Nation).
Limits of this analysis:
- We did not model wind trajectories, so local burning or weather may contribute on individual days. Bangkok also rose on 8 October.
- Our figures are calendar-day averages. The Pollution Control Department reports rolling 24-hour averages, so individual peaks differ (on 17 September our highest calendar-day average was 35.1).
- Some stations track each other unusually closely: Satun and Nakhon Si Thammarat matched to the decimal in about a quarter of hourly readings. This may reflect a uniform smoke layer or how the data is processed.
- Near-real-time readings may be revised after the department’s validation.
How to read haze numbers
- What is counted? Burned area, area still burning, hotspots and “haze-source spots” are four different things.
- Over what period? A one-day figure and a season total can differ a thousandfold.
- Who produced it, and is the method published?
- Concentration or index? PM2.5 in µg/m³, Singapore’s PSI, the US AQI and Thailand’s AQI are different scales. A PSI of 150 does not mean 150 µg/m³.
- Measured or modelled? Hospital cases are measured. Death estimates like CREA’s are modelled and should be described that way.
Method and data
- Source data: hourly PM2.5 from the Pollution Control Department’s Air4Thai network, downloaded 18 October 2026.
- Daily averages: calendar-day means (Bangkok time), calculated only where at least 18 of 24 hourly readings existed, rounded to one decimal.
- Thresholds: Thailand’s 24-hour PM2.5 standard is 37.5 µg/m³ (since June 2023). The WHO 2021 24-hour guideline is 15 µg/m³.
- Not used: third-party aggregator sites, whose terms often restrict analysis, and AQI index values, which are not concentrations.
- Download: daily PM2.5 for 13 southern stations plus Bangkok and Chiang Mai (CSV).
To protect indoor air during haze, see our air purifier range and our guide to the best air purifier for wildfire smoke.
Using these figures? Please credit WEDO AIR Thailand and link to this page: wedo-air.com/blog/southeast-asia-haze-2026-data-notes.

Karl von Luckwald
Since moving to Thailand in 2019, Karl noticed the lack of scientific integrity in air purifier and water filter reviews. In response, he founded WE DO AIR to champion unbiased, science-based evaluations and empower consumers to make better-informed decisions.