
Why Thailand’s air turns bad from November to April, region by region
by Karl von Luckwald / October 22, 2026
Updated 22 October 2026
Every year, Thailand’s air gets dirtier when the rains stop. We compared a year of official PM2.5 readings from six cities, from October 2025 to September 2026. Every one had its worst month between December and April. In Bangkok, the dry months averaged twice the PM2.5 of the rainy months. In Chiang Rai, it was four times.
Three things to know:
- Three things change at once in the dry season. Rain stops washing the air, cool still air traps pollution near the ground, and the burning season starts.
- Each region peaks at a different time. Bangkok and the east are worst in January. The north is worst in March and April. The south stays the cleanest.
- The season ends with the rain. In May, PM2.5 fell in all six cities, by about 80% in Chiang Mai and Chiang Rai.
Every city we checked had its worst air between December and April
We used readings from the Pollution Control Department’s Air4Thai monitors. Here is how each city’s dry season (November to April) compared with its rainy season (June to September):
|
City |
Dry season average |
Rainy season average |
How much worse |
Worst month (2025 to 2026) |
|---|---|---|---|---|
|
Chiang Rai |
37.3 µg/m³ |
9.1 µg/m³ |
4.1 times |
April: 91.0 |
|
Chiang Mai |
33.4 µg/m³ |
12.8 µg/m³ |
2.6 times |
April: 76.5 |
|
Bangkok |
27.5 µg/m³ |
13.5 µg/m³ |
2.0 times |
January: 34.2 |
|
Chonburi |
26.0 µg/m³ |
13.1 µg/m³ |
2.0 times |
January: 33.9 |
|
Songkhla (Hat Yai) |
14.3 µg/m³ |
10.0 µg/m³ |
1.4 times |
January: 18.4 |
|
Phuket |
13.9 µg/m³ |
9.6 µg/m³ |
1.5 times |
January: 16.3 |
Source: Pollution Control Department, Air4Thai (preliminary data). Analysis: WEDO AIR Thailand. The full month-by-month table is at the end of this article.
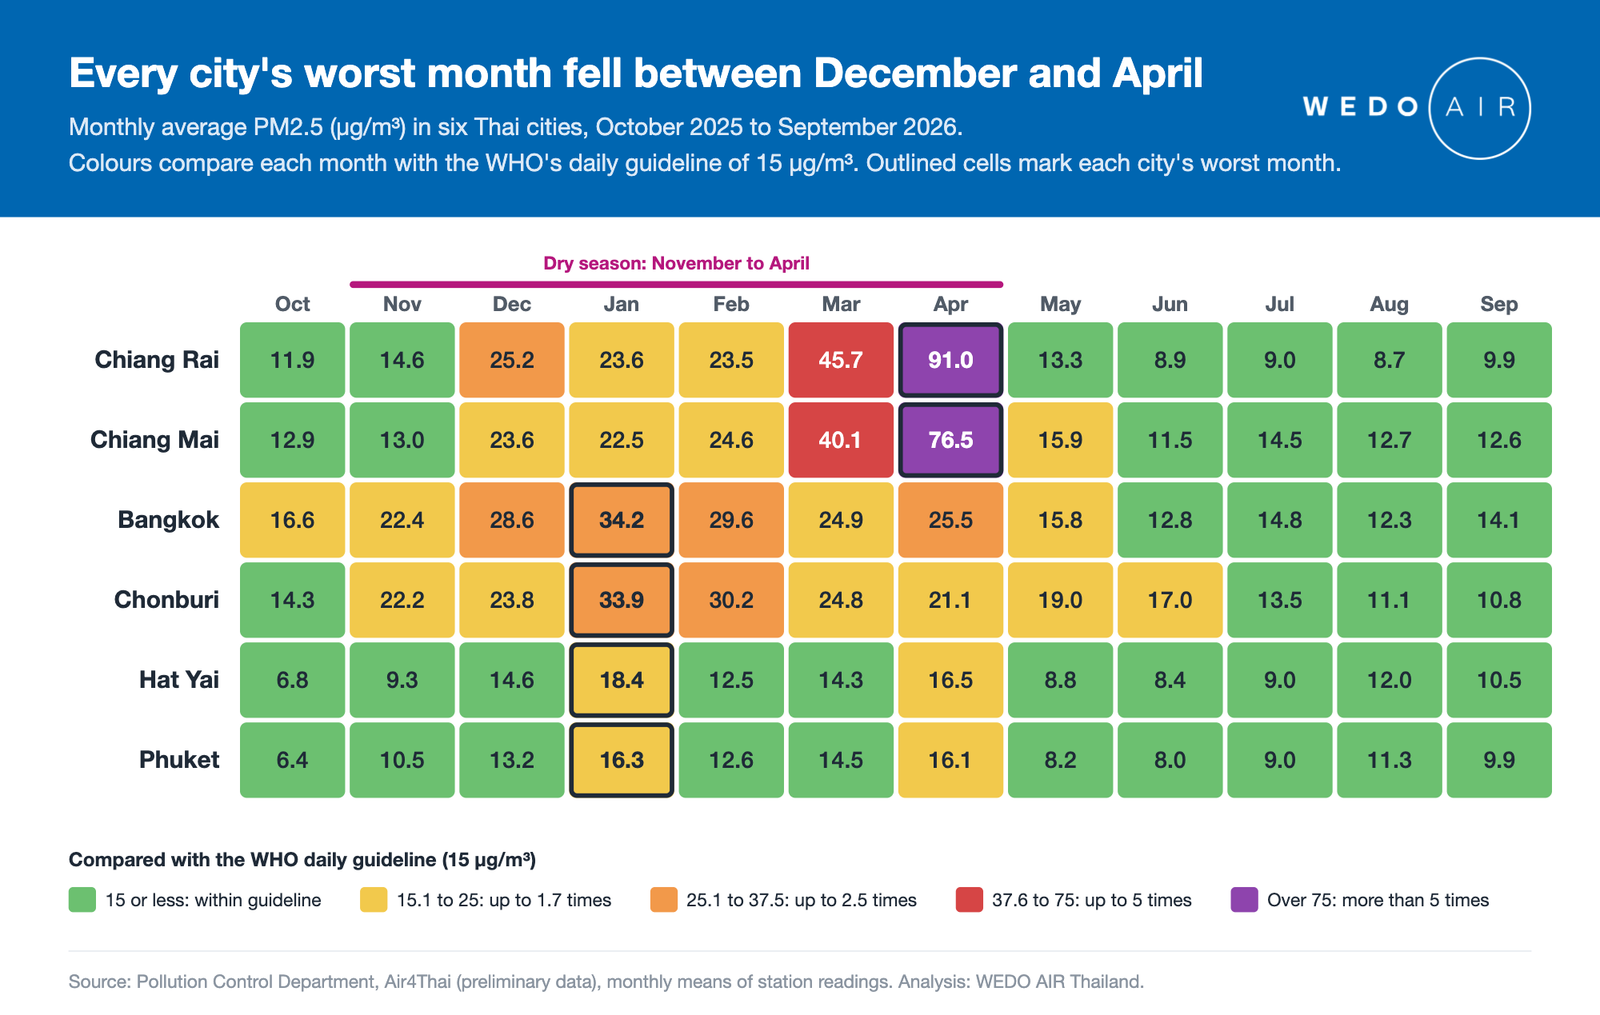
Berkeley Earth estimates that breathing 22 µg/m³ for a day is roughly like smoking one cigarette. By that rule, Chiang Rai’s April, at an average of 91.0 µg/m³, works out to about four cigarettes a day. Bangkok’s January works out to about one and a half.
Thailand’s rating calls air “good” that the WHO says is too dirty
Thailand’s colour rating and the World Health Organization draw the line in different places. The WHO’s guideline says PM2.5 should average no more than 15 µg/m³ over a day. Thailand’s rating still calls air “good” up to 25. Its legal daily limit is 37.5, two and a half times the WHO’s level.
|
PM2.5 over a day |
Thailand’s rating |
Compared with the WHO guideline |
|---|---|---|
|
0 to 15 µg/m³ |
Very good |
Within the guideline |
|
15.1 to 25 µg/m³ |
Good |
Up to 1.7 times |
|
25.1 to 37.5 µg/m³ |
Moderate |
Up to 2.5 times |
|
37.6 to 75 µg/m³ |
Starting to affect health |
Up to 5 times |
|
Over 75 µg/m³ |
Affects health |
More than 5 times |
So a day the app shows as green can carry 1.7 times the PM2.5 the WHO recommends. That is why our chart measures every city against the WHO line. By that measure, Bangkok’s and Chonburi’s monthly averages were above the WHO’s daily guideline in 8 of the 12 months.
When the rains stop, three things change at once
1. The wind turns and the rain stops
From mid-October, the southwest monsoon gives way to the northeast monsoon, says the Thai Meteorological Department. Cool air flows in from high pressure over China. Rain washes particles out of the air, so dry months let pollution build up.
2. Cool, still air traps pollution near the ground
On calm winter nights, a layer of warmer air can sit on top of cooler air near the ground. Scientists call this a temperature inversion. It works like a lid: smoke and exhaust can’t rise and spread out.
A study of Bangkok’s haze episodes found that cold surges from the north started the haze. Pollution then built up as the cold air weakened and the wind dropped, with inversions holding it down. In January 2026, the Pollution Control Department’s director-general put the bad days down to low ventilation and more fire hotspots, both in Thailand and in neighbouring countries (Pattaya Mail).
3. The burning season starts
Harvest season brings fire. Farmers burn crop waste and fields because it is cheap and fast (The Nation). Forest fires add more in the north.
- Rice fields: from 1 November 2025 to 11 January 2026, satellites detected 8,127 hotspots, 3,561 of them in rice fields, mostly in the lower north, central and northeastern plains (Pattaya Mail).
- Sugarcane: about 30% of cane was burned before harvest on average in 2023 to 2024, according to the Office of the Cane and Sugar Board (The Nation).
- A national ban: the government banned agricultural burning from 1 February to 31 March 2026 (Pattaya Mail).
Smoke from neighbouring countries adds to it
Thailand’s neighbours burn in the same season. Recent alerts from ASEAN’s haze centre (ASMC) show the pattern:
|
Alert |
Fires concentrated in |
Smoke reported over |
|---|---|---|
|
2 February 2026 |
Cambodia and northern Myanmar |
Parts of the Mekong region, including central Thailand |
|
27 March 2026 (highest level) |
Myanmar and Laos |
Northern parts of the Mekong region |
Everyday pollution gets trapped too
Traffic, factories and power plants pollute all year. In the rainy season, rain clears much of it. In the dry season, the same exhaust builds up. Earlier research, summarised in a ten-year study of Bangkok, points to traffic and particles formed from other pollutants as the city’s main sources, held in place by stagnant air.
The season ends in May, when the monsoon rain returns
The fires die down and steady rain washes the air. Our data shows how fast it happens in most cities:
|
City |
April |
May |
Drop |
|---|---|---|---|
|
Chiang Rai |
91.0 µg/m³ |
13.3 µg/m³ |
85% |
|
Chiang Mai |
76.5 µg/m³ |
15.9 µg/m³ |
79% |
|
Bangkok |
25.5 µg/m³ |
15.8 µg/m³ |
38% |
|
Phuket |
16.1 µg/m³ |
8.2 µg/m³ |
49% |
|
Chonburi |
21.1 µg/m³ |
19.0 µg/m³ |
10% |
Chonburi cleared later, in June to September.
A single storm can clean the air for an afternoon. The season ends when the rain keeps coming.
Region by region: when it peaks and why
Bangkok: worst in January and February
- Our data: Bangkok’s worst month was January 2026, at 34.2 µg/m³. That is 2.8 times its cleanest month, August.
- Over ten years: from 2015 to 2024, about 3 in 10 January and February days were above today’s daily limit of 37.5 µg/m³ at one Bangkok station. From May to October, it was 3.2% of days or fewer (Thai Environmental Engineering Journal).
- Why: traffic and urban pollution, trapped by still winter air, plus smoke blown in from farm fires. On 28 January 2026, Bangkok averaged 55.6 µg/m³. Satellites found fires on about 13,000 rai of farmland east of the city, and officials blamed burning rather than traffic (The Thaiger).
- Bad days close schools. On 24 January 2025, PM2.5 hit 108 µg/m³ and hundreds of Bangkok schools closed (Al Jazeera).
Chonburi and Pattaya: the same curve as Bangkok
- Our data: Chonburi (monitors in Mueang Chonburi and Si Racha, near Pattaya) peaked in January 2026 at 33.9 µg/m³, almost exactly Bangkok’s level. Its dry season was twice as dirty as its rainy season.
- Pattern: Chonburi’s curve tracks Bangkok’s almost month by month, which suggests the same winter weather is at work. The Pollution Control Department has no monitor in Pattaya itself.
Chiang Mai and Chiang Rai: worst in March and April
- Our data: the north had the highest peaks of any city we checked. Chiang Rai averaged 91.0 µg/m³ in April 2026, ten times its cleanest month. Chiang Mai averaged 76.5.
- Worst days: on 30 March 2026, Wiang Phang Kham near Mae Sai recorded a 24-hour average of 153.5 µg/m³, four times Thailand’s daily limit (Chiang Rai Times).
- Cause 1, forest and land fires: In one model of 2019, non-crop fires inside Thailand accounted for several times more of the north’s PM2.5 than crop burning did.
- Cause 2, smoke from abroad: In another model of 2019, fires across the border accounted for 45% of Chiang Mai’s March PM2.5 and 68% of Chiang Rai’s.
- Cause 3, the valleys: Chiang Mai sits in a basin prone to temperature inversions, which can stop the wind from clearing the smoke (NASA).
- April stays bad. Fires keep burning into April, and short storms bring only brief relief. Over 2011 to 2020, Chiang Mai’s April still averaged 57.6 µg/m³ (Jainonthee et al.). In 2026, April was the worst month of the year.
Isan (the northeast): rice-stubble burning
- Worst days: Nong Khai hit 100.4 µg/m³ on 13 January 2026 (Pattaya Mail).
- Why: farm burning. In early February 2026, PM2.5 in the northeast worsened for five days in a row while authorities found rice-stubble burning in Nakhon Ratchasima, Chaiyaphum, Buri Ram and Surin (Khaosod English).
Phuket and Hat Yai: the cleanest, with a second risk from Indonesian smoke
- Our data: Phuket and Songkhla (Hat Yai) had the cleanest air of the six cities. Their worst months, January to April, averaged 16 to 18 µg/m³, about half of Bangkok’s peak.
- Different weather: the south’s rains run later. Heavy rain still falls there in late October, after the rest of the country has started to dry out (Thai Meteorological Department).
- The second risk: from about May to November, southwest winds can carry smoke from fires in Indonesia north, and Songkhla is hit harder than Phuket (Shokoohinia et al.). On the evening of 25 August 2026, Hat Yai’s hourly readings climbed to around 30 µg/m³ (Pattaya Mail). Our analysis of southern Thailand’s haze shows how these episodes play out.
What you can do this season
- Know your region’s worst months. Bangkok and the east: December to February. The north: March and April. The south: January to April, plus occasional Indonesian haze between May and November.
- Check the PM2.5 number each morning on Air4Thai. Early mornings are often the worst, when the air is stillest.
- Keep indoor air clean on bad days. Close windows and run a HEPA air purifier sized for the room. Our air purifier range covers homes, classrooms and offices. In the north, see our page on air purifiers in Chiang Mai.
PM2.5 particles are small enough to reach deep into the lungs. The WHO links air pollution to stroke, heart disease, lung cancer and chronic lung disease.
The data: monthly PM2.5 in six Thai cities
|
Month |
Bangkok |
Chiang Mai |
Chiang Rai |
Chonburi |
Phuket |
Hat Yai |
|---|---|---|---|---|---|---|
|
Oct 2025 |
16.6 |
12.9 |
11.9 |
14.3 |
6.4 |
6.8 |
|
Nov 2025 |
22.4 |
13.0 |
14.6 |
22.2 |
10.5 |
9.3 |
|
Dec 2025 |
28.6 |
23.6 |
25.2 |
23.8 |
13.2 |
14.6 |
|
Jan 2026 |
34.2 |
22.5 |
23.6 |
33.9 |
16.3 |
18.4 |
|
Feb 2026 |
29.6 |
24.6 |
23.5 |
30.2 |
12.6 |
12.5 |
|
Mar 2026 |
24.9 |
40.1 |
45.7 |
24.8 |
14.5 |
14.3 |
|
Apr 2026 |
25.5 |
76.5 |
91.0 |
21.1 |
16.1 |
16.5 |
|
May 2026 |
15.8 |
15.9 |
13.3 |
19.0 |
8.2 |
8.8 |
|
Jun 2026 |
12.8 |
11.5 |
8.9 |
17.0 |
8.0 |
8.4 |
|
Jul 2026 |
14.8 |
14.5 |
9.0 |
13.5 |
9.0 |
9.0 |
|
Aug 2026 |
12.3 |
12.7 |
8.7 |
11.1 |
11.3 |
12.0 |
|
Sep 2026 |
14.1 |
12.6 |
9.9 |
10.8 |
9.9 |
10.5 |
Monthly average PM2.5 in µg/m³. Bold marks each city’s worst month.
How we did this. We averaged the Pollution Control Department’s daily PM2.5 readings into monthly means for each station, then averaged stations within each city. Bangkok uses four stations (two general, two roadside). Chiang Mai and Chonburi use two each. Chiang Rai, Phuket and Hat Yai use one each. October 2025 to June 2026 come from PCD’s daily data files, July from its monthly station reports, and August and September from its hourly data. PCD marks 2026 data as preliminary. Monthly averages hide the worst days, so a month that averages 34 µg/m³ includes days far above that.
Using these figures? Please credit WEDO AIR Thailand and link to this page: wedo-air.com/blog/thailand-air-pollution-season.

Karl von Luckwald
Since moving to Thailand in 2019, Karl noticed the lack of scientific integrity in air purifier and water filter reviews. In response, he founded WE DO AIR to champion unbiased, science-based evaluations and empower consumers to make better-informed decisions.